15 Phylogenomics
For this chapter’s exercises, if not already performed, you will need to download the chapter’s dataset, decompress the archive, and create and activate the conda environment.
Do this, use wget or right click and save to download this Zenodo archive: 10.5281/zenodo.17155402, and unpack.
tar xvf phylogenomics.tar.gz
cd phylogenomics/
You can then create the subsequently activate environment with
conda env create -f phylogenomics.yml
conda activate phylogenomicsThere are additional software requirements for this chapter
Please see the relevant chapter section in Before you start before continuing with this chapter.
15.1 Introduction
15.1.1 Definitions and concepts
Phylogenetics is the study of evolutionary relationships between entities such as species, genes or individuals (but also non-biological entities such as languages), through the reconstruction of phylogenetic trees. Phylogenetic trees are composed of branches (or edges) representing continuous lines of descent (or lineages), nodes representing the split of an ancestral lineage into descending lineages, and tips (or leaves) representing the sampled entities (Baum et al. 2008) (Figure 15.1).

In a phylogenetic tree, a group containing all descendants of a given ancestor (or node), is called a monophyletic group, or a clade (Figure 15.2). Any group that is not monophyletic is called paraphyletic.

The oldest node in a phylogenetic tree is called the root (Figure 15.3). It corresponds to the most recent common ancestor (MRCA) of the whole group under consideration. The root is not defined in all phylogenetic trees. If so, it means that the tree is oriented in time, such that we can define which node is the oldest. We call such tree a rooted tree. Note that time-trees are rooted by definition (but the opposite is not true). Substitution trees are in principle unrooted, as these contain information about the genetic distance between nodes, but not about the relative age of nodes. Unrooted trees are best represented in a star-shaped manner (although visualization softwares such as figtree present all trees as if they were rooted, by default).

An unrooted tree can be turned into a rooted tree if one can define an outgroup among the analysed entities (Figure 15.4). An outgroup is a tip or a clade that can be confidently considered to not belong to the group formed by the rest of the tips (the ingroup). Typically, this can be an individual from a different species than the one under consideration. If one can define such an outgroup a priori, then the root of the tree can be placed on the branch between the outgroup and the ingroup. Outgroups can be included intentionally in phylogenetic analyses for this purpose.

15.1.2 Phylogenetics: what for?
Phylogenetic analyses are useful for a variety of applications, but its primary goal is to characterise and classify the observed biological diversity with an evolutionary perspective. Thus, phylogenies are essential to organise and interpret all knowledge about biological organisms in the light of evolution (Figure 15.5).

Furthermore, phylogenetic trees can be used in combination with various information about the sampled entities to reconstruct the characteristics of past lineages and changes that have occurred during the course of evolution (Figure 15.6). Typically, phylogenies can be combined with information about the geographic location of sampled entities to reconstruct the geographic spread of the studied organism in the past. Similarly, information about the host-species of pathogen strains can be used to identify past cross-species transmission events. Similar approaches can be applied to genetic features to map genomic changes such as gene loss or gain on the phylogeny. Note that if the phylogeny is calibrated in time, the date of these events can be estimated.

Phylogenies can also be used to obtain information about past epidemiological or population dynamics (Figure 15.7). Typically the time to the most recent common ancestor (tMRCA) of pathogen strains can be considered as an upper date limit for the emergence of the pathogen in the considered population. Using phylodynamic approaches, population or epidemiological parameters can be formally estimated through the phylogeny.

15.1.3 Phylogenetic analysis of ancient genomes
Ancient genomes are powerful data for phylogenetic inference for several reason. The most obvious one is that they might allow uncovering lineages that have gone extinct in the past, thereby including in the phylogeny parts of the evolutionary history that are invisible from modern data alone. Furthermore, by providing direct observations from the past, ancient genomes may permit accurate reconstruction of past evolutionary events and phylogeographic scenarios which can be otherwise impossible to unveil (Figure 15.8).

Another fundamental advantage of ancient genomes for phylogenetic inference is that they can be used to estimate the rate of genetic changes of the studied group and calibrate phylogenies in time (Figure 15.9) using molecular clock models (as performed in the last part of the practical). This is often difficult or impossible to do with modern sequences data alone, except for fast-evolving entities like RNA viruses.

15.1.4 How to estimate phylogenetic trees?
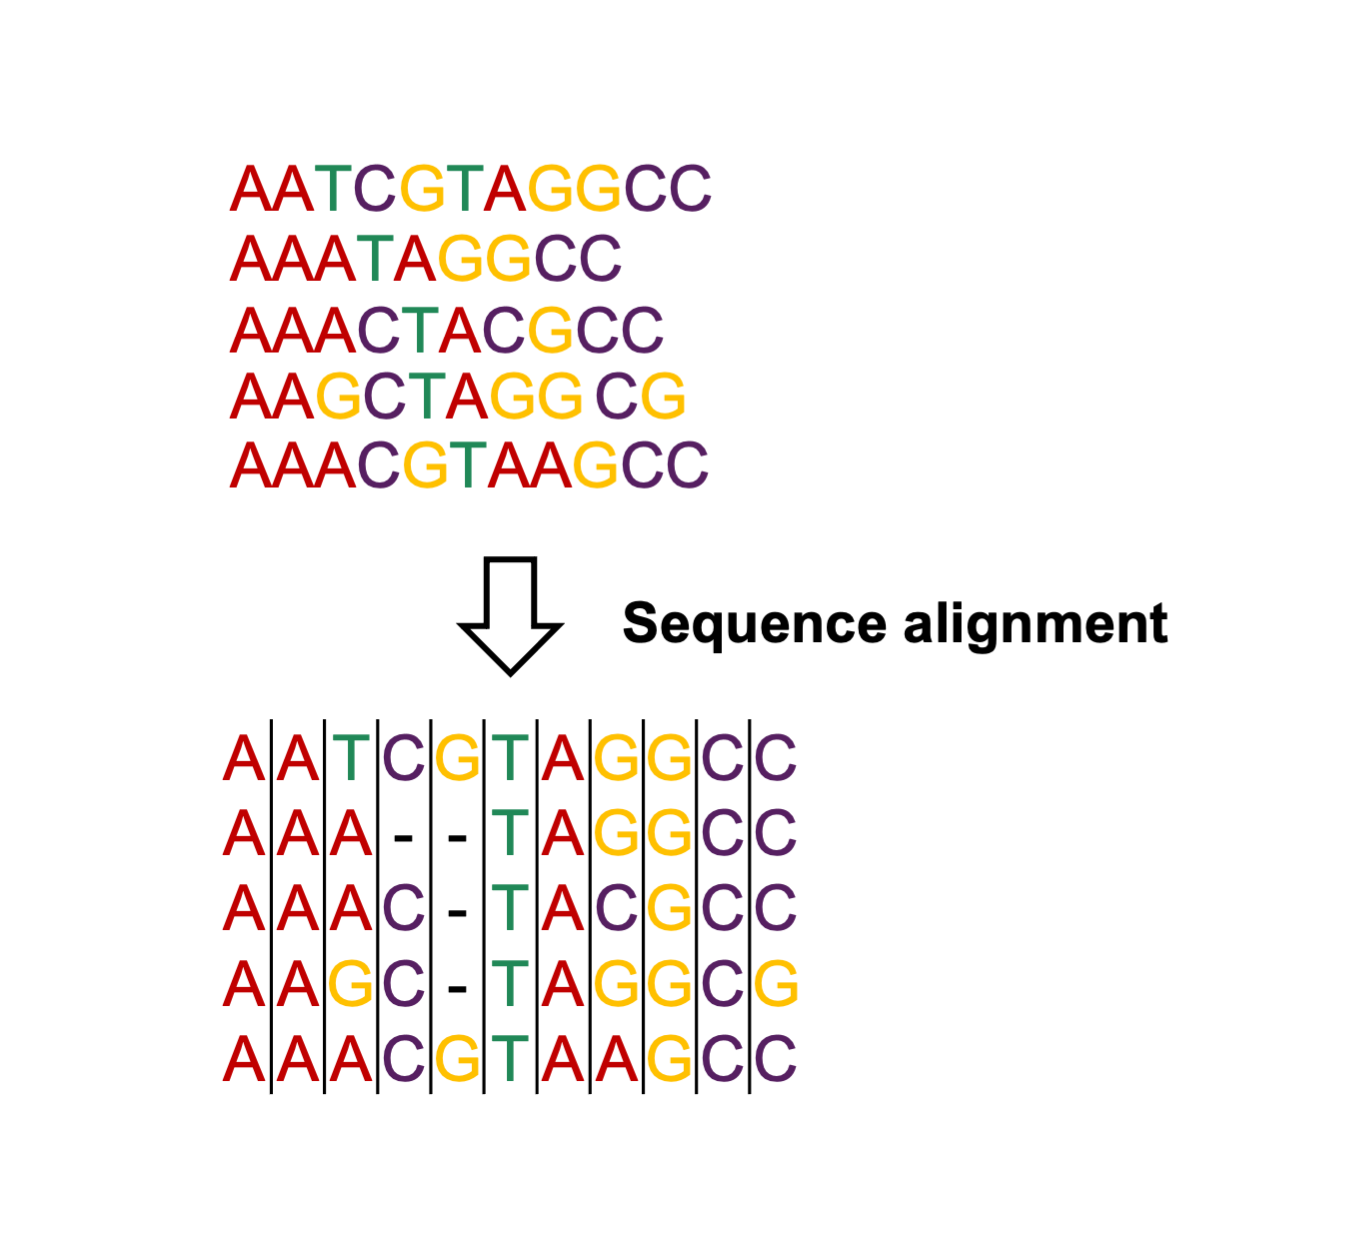
Before reconstructing a phylogenetic tree from a set of DNA sequences, these sequences need to be aligned. Sequence alignment consist in rearranging sequences to ensure that homologous nucleotide positions (i.e. descending from a common ancestor) are aligned and compared (Figure 15.10). To do so, gaps are inserted in sequences to accommodate genetic insertions or deletions that might have occurred in these sequences during the course evolution. Although it will not be covered in this practical, sequence alignment is an essential first step for phylogenetic analyses (or any comparative genetic analysis), and can be performed in different ways depending on the starting material. If one starts from already assembled gene or genome sequences, multiple sequence alignment can be performed using softwares such as clustal or MAFFT. When analysing NGS data, one can map all data to the same reference genome and produce combined genotyping data and sequence alignments using softwares such as MultiVCFAnalyzer (as performed in the Genome Mapping practical).
Various methods can be employed to infer a phylogenetic tree from a DNA sequence alignment (Figure 15.11). Distance-based methods are based on pairwise genetic distance matrices derived from the sequences rather than from the sequences themselves. This includes techniques like Neighbour-Joining and UPGMA. Maximum parsimony is another method in which it is assumed that the most likely tree is the one minimizing the number of changes necessary to explain the observed sequences. Finally probabilistic methods are methods based on an explicit probabilistic model of evolution which allows calculating the probability of the observed sequence data given a certain phylogenetic tree. This measure is referred to as the phylogenetic likelihood. Probabilistic approaches are, by far, the most popular phylogenetic approaches nowadays, and fall into two categories: Maximum Likelihood (ML) and Bayesian approaches.

An important component of phylogenetic models is the genetic substitution model (Yang 2014). Substitution models are used in distance-based and probabilistic phylogenetic approaches (Figure 15.12). In essence, these models allow estimating genetic distances between sequences accounting for cases in which multiple substitutions might have occurred at the same sites. Different substitution models exist allowing for more or less complexity, from the Jukes-Cantor (JC69) model in which all types of substitutions are assumed to occur at the same rate to General Time-Reversible (GTR) model (which is the GTR model) in which each type of substitution occurs at a different rate.

15.2 Practical
15.2.1 Visualise the sequence alignment
In this practical session, we will work with an alignment produced as you learned in the practical Genome mapping.
- The alignment contains 33 Yersinia pestis sequences and 1 Yersinia pseudotuberculosis sequence which can be used as an outgroup
- It is a SNP alignment: it contains only the variable genomic positions, not the full genomes
- In this practical, we will investigate the phylogenetic position of four prehistorical Y. pestis strains that we have recently discovered: KZL002, GZL002, CHC004 and VLI092
We start by exploring the alignment in MEGA (Tamura, Stecher, and Kumar 2021). Open the MEGA desktop application in the terminal.
mega &Adding & at the end of a command line allows to run a program in the background while letting the terminal accessible. This is particularly useful when starting a graphical interface from the terminal.
Then, load the alignment by clicking on File -> Open A File/Session -> Select the snpAlignment_session5.fasta (in the working directory of the session).

It will ask you what you want to do with the alignment. In MEGA you can also align sequences. However, since our sequences are already aligned, press onAnalyze.
Then, selectNucleotide Sequences since we are working with a DNA alignment. Note thatMEGA can also work with Protein Sequences as well as Pairwise Distance Matrix (which we will cover shortly). In the same window, change the character forMissing Data to N and clickOK.

A window would open up asking if our alignment contains protein encoding sequences, and we will selectNo.
To explore the alignment, click on the box with TA.

You should see an alignment containing sequences from the bacterial pathogen Yersinia pestis. Within the alignment, we have four sequences of interest (KZL002, GZL002, CHC004 and VLI092) that date between 5000-2000 years Before Present (BP), and we want to know how they relate to the rest of the Yersinia pestis genomes in the alignment.

How many sequences are we analysing?
34 sequences
What are the Ns in the sequences?
They represent positions where we have missing data. We toldMEGA to encode missing positions as N.
What do you think the dots represent?
The first line is a consensus sequence: it indicates the nucleotide supported by the majority of the sequences in the alignment (90% of the sequences should agree, otherwise an N is displayed)
Dots represent positions in which sequences are identical to the reference the consensus
Once you know this, can you already tell by looking at the alignment which sequence is the most divergent (scroll down)
We can easily see that the last sequence in the alignment (Y. pseudotuberculosis) contains more disagreements to the consensus. This is normal since this is the only genome not belonging to the Y. pestis species: we will use it as an outgroup
15.2.2 Distance-based phylogeny: Neighbour-Joining
The Neighbour-Joining (NJ) method is an agglomerative algorithm which can be used to derive a phylogenetic tree from a pairwise distance matrix. In essence, this method groups taxa that have the shortest distance together first, and repeats this operation iteratively until all the taxa/sequences included in your alignment have been placed in a tree.
Here are the details of the calculations for a small NJ tree example with 6 taxa:

Luckily, you won’t have to do this by hand since MEGA allows you to build a NJ tree. For that go back to MEGA and click on the Phylogeny symbol (toolbar of the main menu window) and then select Construct Neighbour Joining Tree. Click Yes when you are asked if you want to use the currently active data. In the window that pop up, you will then change theModel/Method to p-distance. Then press OK and a window with the calculated phylogenetic tree will pop up.

A NJ tree can be built from any type of distances. This includes: - p-distances (also called raw distances): these are simply the proportion of differences between sequences - Corrected distances: these are based on an underlying substitution model (JC69, K80, GTR…) and account for multiple substitutions at the same sites (which would result in only one visible difference) - p-distances and corrected distances should be similar when the number of substitutions is low compared to the genome length note: a “substitution” is a type of mutation in which a nucleotide is replaced by another.
Since the tree is not easily visualised in MEGA, we will export it in newick format (a standard text format for trees) and open it in figtree. This tool has a better graphical interface for visualizing and manipulating trees.
To do that, click on File, then Export current tree (Newick) and click on Branch Lengths to include those in the newick annotation. When you press OK, a new window with the tree in newick format will pop up. Then, press File -> Save and saved it as NJ_tree.nwk. You can then close the text editor and tree explorer windows (no need to save the session).

As said above, we will explore oun NJ tree in figtree. Open the software (if you use the same terminal window as the one in which you ran MEGA, you might have to press enter first).
figtree &Then, open the NJ tree by clicking on File -> Open and selecting the file with the NJ tree NJ_tree.nwk.

Note that even though a root is displayed by default in figtree, NJ trees are actually unrooted. We know that Yersinia pseudotuberculosis (labelled here as Y. pseudotuberculosis) is an outgroup to Yersinia pestis. You can reroot the tree by selecting Y.pseudotuberculosis and pressing Reroot.

Now we have a rooted tree.
How much time did the NJ-tree calculation take?
~1 second
How many leaves/tips has our tree?
34, i.e. the number of sequences in our SNP alignment.
Where are our taxa of interest? (KZL002, GZL002, CHC004 and VLI092)
They all fall ancestral to the rest of Yersinia pestis in this tree.
Do they form a monophyletic group (a clade)?
Yes, they form a monophyletic group. We can also say that this group of prehistoric strains form their own lineage.
15.2.3 Probabilistic methods: Maximum Likelihood and Bayesian inference
These are the most commonly used approach today. In general, probabilistic methods are statistical techniques assuming that the observed data is generated through a stochastic process with a probablility depending on a set of parameters which we want to estimate. The probability of the data given the model parameters is called the likelihood.

In a phylogenetic probabilistic model, what are the data and what are the parameters?
In a phylogenetic probabilistic model, the data is the sequence alignment and the parameters, are:
- The parameters of the chosen substitution model (substitution rates and base frequencies)
- The phylogenetic tree

15.2.4 Maximum likelihood estimation and bootstrapping
One way to make inferences from a probabilistic model is by finding the combination of parameters which maximises the likelihood. These parameter values are called Maximum Likelihood (ML) estimates. We are usually not able to compute the likelihood value for all possible combinations of parameters and have to rely on heuristic algorithms to find the ML estimates.

The ML estimates are point estimates, i.e. single parameter values (for example, a tree), which does not allow to measure the associated uncertainty. A classic method to measure the uncertainty in ML trees is bootstrapping. This consists in repeatedly “disturbing” the alignment by masking sites randomly and estimating a tree from each of these bootstrap alignments.

For each clade in the ML tree, a bootstrap support value is computed which corresponds to the proportion of bootstrap trees containing the clade. This gives an indication of how confidently the clade is supported by the data (i.e. whether it is robust to small changes in the data). A bootstrap value of 70% or more is generally considered as good support.
Bootstrapping can be used to measure uncertainty with any type of inference method, including distance-based methods
Let’s make our own ML tree!
Here is a command to estimate an ML phylogenetic tree together with bootstraps using RAxML((Stamatakis 2014); you may find the list of parameters in the RAxMLmanual).
raxmlHPC-PTHREADS -m GTRGAMMA -T 3 -f a -x 12345 -p 12345 -N autoMRE -s snpAlignment_session5.fasta -n full_dataset.treHere is the meaning of the chosen parameters:

Once the analysis has been completed, you can open the tree using FigTree(RAxML_bipartitions.full_dataset.tre file, change “label” to “bootstrap support” at the prompt).

The tree estimated using this model is a substitution tree (branch lengths represent genetic distances in substitutions/site). As for the NJ tree, it is not oriented in time: this is an unrooted tree (displayed with a random root in Figtree). You can reroot the tree in figtree using Y. pseudotuberculosis as an outgroup, as previously.
Can you confirm the position of our genomes of interest (KZL002, GZL002, CHC004 and VLI092)?
Yes. Just as in the NJ tree, they form a clade which is basal to the rest of the Y. pestis diversity.
Is that placement well-supported (look at the bootstrap support value: click on the “Node Labels” box and open the drop-down menu, change “Node ages” to “bootstrap support”)?
The placement is strongly supported as indicated by a bootstrap support of 100% for this clade (it is not very easy to see, you probably need to zoom in a bit)

You can notice that the phylogeny is difficult to visualise due to the long branch leading to Y. pseudotuberculosis Having a very distant outgroup can also have deleterious effects on the estimated phylogeny (due to the so-called “long branch attraction” effect). We can construct a new phylogeny after removing the outgroup: - Go back to the original alignment in mega (that we used for the Neighbour Joining tree), untick Y.pseudotuberculosis, and export in fasta format (Data -> Export Data and change Format to Fasta and click Ok; you can save it as: snpAlignment_without_outgroup.fas) - Run raxml on this new alignment (change input to snpAlignment_without_outgroup.fas and output prefix (-n) to without_outgroup in the command line) - Open the bipartition... file in figtree and reroot the tree based on the knowledge we have gained previously: place the root on the branch leading to the prehistoric Y. pestis strains (KZL002, GZL002, CHC004 and VLI092).

Lastly, we will export the rooted tree from figtree: File -> Export trees -> select the save as currently displayed box and save as ML_tree_rooted.tre (this will be useful for the section Temporal signal assessment at the end of this tutorial)

15.2.5 Estimating a time-tree using Bayesian phylogenetics (BEAST2)
Now, we will try to use reconstruct a phylogeny in which the branch lengths do not represent a number of substitutions but instead represent the time of evolution. To do so, we will use the dates of ancient genomes (C14 dates) to calibrate the tree in time. This assumes a molecular clock hypothesis in which substitutions occur at a rate that is relatively constant in time so that the time of evolution can be estimated based on the number of substitutions.
A great advantage of ancient pathogen genomes is that they provide calibration points to estimate molecular clocks and dated phylogenies. This might not be possible to do with modern data alone.
We will estimate a time-tree from our alignment using Bayesian inference as implemented in the BEAST2 software (Bouckaert et al. 2014; Drummond and Bouckaert 2015). Bayesian inference is based on a probability distribution that is different from the likelihood: the posterior probability. The posterior probability is the probability of the parameters given the data. It is easier to interpret than the likelihood because it directly contains all the information about the parameters: point estimates such as the median or the mean can be directly estimated from it, but also percentile intervals which can be used to measure uncertainty.

The Bayes theorem tells us that the posterior probability is proportional to the product of the likelihood and the prior probability of the parameters:

Therefore, for Bayesian inference, we need to complement our probabilistic model with prior distributions for all the parameters. Because we want to estimate a time tree, we also add another parameter: the molecular clock (average substitution rate in time units).

To characterise the full posterior distribution of each parameter, we would need in theory to compute the posterior probability for each possible combination of parameters. This is impossible, and we will instead use an algorithm called Markov chain Monte Carlo (MCMC) to approximate the posterior distribution. The MCMC is an algorithm which iteratively samples values of the parameters from the posterior distribution. Therefore, if the MCMC has run long enough, the posterior distribution of the parameters can be approximated by a histogram of the sampled values.

The “Taming the beast” website (https://taming-the-beast.org/tutorials/) has great tutorials for various analyses that can be done with BEAST2. In particular, the “Introduction to BEAST2”, “Prior selection” and “Time-stamped data” are good starts.
The different components of the BEAST2 analysis can be set up in the program BEAUti:

Open BEAUTi (if asked to update, press ‘not now’).
beauti &Set up an analysis as follows:
- Load the alignment without outgroup in the
Partitionstab (File -> Import alignment; selectnucleotide)

- Set the sampling dates in the
Tip datestab:- Select
Use tip dates - Click on
Auto-configure -> Read from fileand select thesample_ages.txtfile - Change
Since some time in the pasttoBefore present
- Select

- Select the substitution model in the
Site modeltab:- Chose a GTR model
- Use 4 Gamma categories for the Gamma site model: this is to account for variations of the substitution rate across sites (site=nucleotide position)

- choose the molecular clock model in the
Clock modeltab:- Use a relaxed clock lognormal model (this is to allow for some variation of the clock rate across branches)
- Change the initial value of the clock rate to 10-4 substitution/site/year (10-4 can be written 1E-4)

- Choose the prior distribution of parameters in the
Priorstab:- Use a Coalescent Bayesian Skyline tree prior
- Change the mean clock prior to a uniform distribution between 1E-6 and 1E-3 subst/site/year
- Leave everything else to default

- Set up the MCMC in the
MCMCtab:- Use a chain length of 300M
- Sample the mono-dimensional parameters and trees every 10,000 iterations (unfold
tracelogandtreelogmenus and change “log every” to 10,000)

- Save the analysis setup as an xml file:
File -> Save as; you can name the filebeast_analysis_Y_pestis.xml
Now that the analysis is setup, we can run it using BEAST.
beast -java beast_analysis_Y_pestis.xmlOnce the analysis is running two files should have been created and are continuously updated:
- The
snpAlignment_without_outgroup.logfile which contains the values sampled by the MCMC for various mono-dimensional parameters such as the clock rate, as well as other values that are a logged along the MCMC such as the posterior probability and the likelihood - The
snpAlignment_without_outgroup.treesfile which contains the MCMC trees sampled by the MCMC
While the analysis is running, you can start reading the next section!
15.2.6 Assessing BEAST2 results
We are using an MCMC algorithm to sample the posterior distribution of parameters. If the MCMC has run long enough, we can use the sampled parameters to approximate the posterior distribution itself. Therefore, we have to check first that the MCMC chain has run long enough.
We can assess the MCMC sampling using the program Tracer (Rambaut et al. 2018). Tracer can read BEAST log files an generate statistics and plots for each of the sampled parameters. Most importantly, Tracer provides:
Trace plots: show the sampled parameter values along the MCMC run
Trace plots are a very useful MCMC diagnostic tool.

Figure 15.42: Trace plot visualised in Tracer. The first thing that one needs to assess is whether the MCMC has passed the so called “burn-in” phase. The MCMC starts with a random set of parameters and will take some time to reach a zone of high posterior probability density. The parameter values that are sampled during this initial phase are usually considered as noise and discarded (by default, tracer discards the first 10% of samples). The burn-in phase can be visualised on trace plots as an initial phase during which the posterior probability of sampled parameters is constantly increasing before reaching a plateau:

Figure 15.43: Burnin phase of the MCMC. Once the burn-in phase is passed, one can look at the trace plots to assess if the parameters have been sampled correctly and long enough. Usually, when this is the case, the trace should be quite dense and oscillating around a central value (nice trace plots should look like “hairy caterpillars”). In the figure below, the trace on the left doesn’t look good, the one on the right does:

Figure 15.44: Assessing correct MCMC sampling using trace plots. ESS values: tracer also calculates effective sample sizes (ESS) for each of the sampled parameters.
ESSs are estimates of the number of sampled parameter values after correcting for auto-correlation along the MCMC. As a rule of thumb, one usually considers that an MCMC has run long enough if all parameter’s ESS are > 200. Note that if the trace looks like a hairy caterpillar, the corresponding ESS value should be high.

Figure 15.45: Assessing effective sample sizes (ESS) in Tracer. Parameter estimates:
Traceralso provides statistics and plots to explore the posterior distribution of the parameters.These should be considered only if the trace plot and ESS values look fine. In the
Estimatestab, after selecting the chosen parameter in the left panel, the upper-right panel shows point estimates (mean, median) and measures of uncertainty (95% HPD interval), and the bottom-right panel shows a histogram of the sampled value:
Figure 15.46: Marginal estimates of parameters in Tracer.
Let’s now load the snpAlignment_without_outgroup.log file into Tracer.
While the run is still going, open a new separate terminal and activate the conda environment.
conda activate phylogenomicsThen, open Tracer.
tracer &Open the log file: File -> Import trace file and select snpAlignment_without_outgroup.log. Note that one can load a BEAST2 log file into Tracer even if the analysis is still running. This allows to assess if the MCMC is running correctly or has run long enough before it’s completed.
Has the MCMC run long enough?
You have probably run your analysis for 10-20 mins before looking at the log file, and this is definitely not sufficient: the burnin phase has recently been passed, the trace plots do not look very dense and ESS values are low. It would probably take a few hours for the analysis to complete. Luckily we have run the analysis in advance and saved the log files for you in the intermediateFiles folder: snpAlignment_without_outgroup.log and snpAlignment_without_outgroup.trees.

You can now load the intermediateFiles/snpAlignment_without_outgroup.log file into Tracer.
Has the MCMC run long enough?
Yes! The trace plots look good and all ESSs are > 200.

What is your mean estimate of the clock rate (ucld mean)?
~7.10-6 substitution/site/year. Note, however, that this estimate is largely biased since we used a SNP alignment containing only variable positions. In order to get an unbiased estimate of the substitution rate, we should have used the full alignment or account for the number of constant sites by using a “filtered” alignment (see here: https://www.beast2.org/2019/07/18/ascertainment-correction.html). In general, this is good practice since not accounting for conserved positions in the alignment can sometimes affect the tree topology as well (although this should usually be minor).

15.2.7 MCC tree
Since we are working in a Bayesian framework, we do not obtain a single phylogenetic tree as with Maximum likelihood, but a large set of trees which should be representative of the posterior distribution. In contrast with mono-dimensional parameters, a tree distribution cannot be easily summarised with mean or median estimates. Instead, we need to use specific tree-summarizing techniques. One of the most popular is the maximum clade credibility (MCC) tree (Heled and Bouckaert 2013), which works as follows:
- For any node in any of the sampled trees, compute a posterior support: the proportion of trees in the sample which contain the corresponding clade
- Select the MCC tree: this is the tree in which the product of node posterior supports is the highest
- Calculate node/branch statistics on the MCC tree: typically, the mean/median estimates and HPD interval of node ages are calculated from the full tree sample and annotated on the MCC tree

Let’s generate an MCC tree from our tree sample. We can do this using the TreeAnnotator software, which has both a command line and graphical interface. Let’s use the command line here and run the following (using a burn-in of 10%).
treeannotator -burnin 10 intermediateFiles/snpAlignment_without_outgroup.trees snpAlignment_without_outgroup.MCC.treeOnce this is completed, we can open the MCC tree (snpAlignment_without_outgroup.MCC.tree) with figtree. Let’s then add a few elements to the plot:
- Tick the
Scale Axisbox, unfold the corresponding menu, and selectReverse axis(now the timescale is in years BP) - Tick the
Node Labelsbox, unfold the corresponding menu, and selectDisplay: posteriorThe posterior support of each node is now displayed Note that the support value is a proportion (1=100%) - Tick the
Node Barsbox, unfold the corresponding menu, and selectDisplay: height_95%_HPDThe 95% HPD intervals of node ages are now displayed

Is the root of the tree consistent with what we found previously?
Yes! The root is placed between our prehistoric strains and the rest of Y. pestis strains. Note that this time we didn’t have to use an outgroup because we estimated a time-tree: the root is identified as the oldest node in the tree.
What is your estimate for the age of the most recent common ancestor of all Y. pestis strains?
~5800 years BP (HPD 95%: ~8000-4500 years BP)
15.2.8 Bonus: Temporal signal assessment
It is a good practice to assess if the genetic sequences that we analyse do indeed behave like molecular clocks before trying to estimate a time tree (i.e. we should have done this before the actual BEAST2 analysis). A classic way to assess the temporal signal of a dataset is the root-to-tip regression (Rambaut et al. 2016). The rationale of the root-to-tip regression is to verify that the older a sequence is, the closer it should be to the root in a (rooted) substitution tree because there was less time for substitution to accumulate. In other words, there should be a correlation between sample age and distance to the root, which we can assess using a linear regression (root-to-tip regression). This can be done using the program TempEst: 1. Open TempEst
```bash
tempest &
```- Load the rooted ML tree that we produced previously (you should have saved it as
ML_tree_rooted.tre) - Click on
Import Datesin theSample Datestab, select thesample_age.txtfile and click onOK - Still in the
Sample Datestab, changeSince some time in the pasttoBefore present(one might need to extend theTempEstwindow to see the pull down menu) - Look at the
Root-to-tip tab: is there a positive correlation between time and root-to-tip divergence as expected under the molecular clock hypothesis?

15.3 (Optional) clean-up
Let’s clean up your working directory by removing all the data and output from this chapter.
You can close all windows and any terminals. If you have a terminal with a command still running, just press ctrl + c a couple of times until it drops you to an empty prompt.
Once completed, the command below will remove the /<PATH>/<TO>/phylogenomics directory as well as all of its contents.
Always be VERY careful when using rm -r. Check 3x that the path you are specifying is exactly what you want to delete and nothing more before pressing ENTER!
rm -r /<PATH>/<TO>/phylogenomics*Once deleted you can move elsewhere (e.g. cd ~).
We can also get out of the conda environment with.
conda deactivateTo delete the conda environment.
conda remove --name phylogenomics --all -y15.4 Summary
- Phylogenetics is the study of the evolutionnary history and relationships between biological entities
- Phylogenetic analyses are essential to classify and organise all knowledge about biological organisms in the light of evolution
- Phylogenetic trees can be used to trace back various features along past lineages, such as the geographic location, host species or genomic content
- Ancient genomes permit more accurate phylogenetic reconstructions and the study of past extinct lineages
- Ancient genomes allow estimating molecular clock rates and the scaling of phylogenetic trees to time
- Phylogenetic inference relies on the comparison of homologous characters, such as aligned DNA sequences
- Probabilistic methods, including Maximum Likelihood and Bayesian inference, are the most popular phylogenetic approaches today