6 Internal Barcode Ligation Bias
CARICATURE PLOT GOES HERE
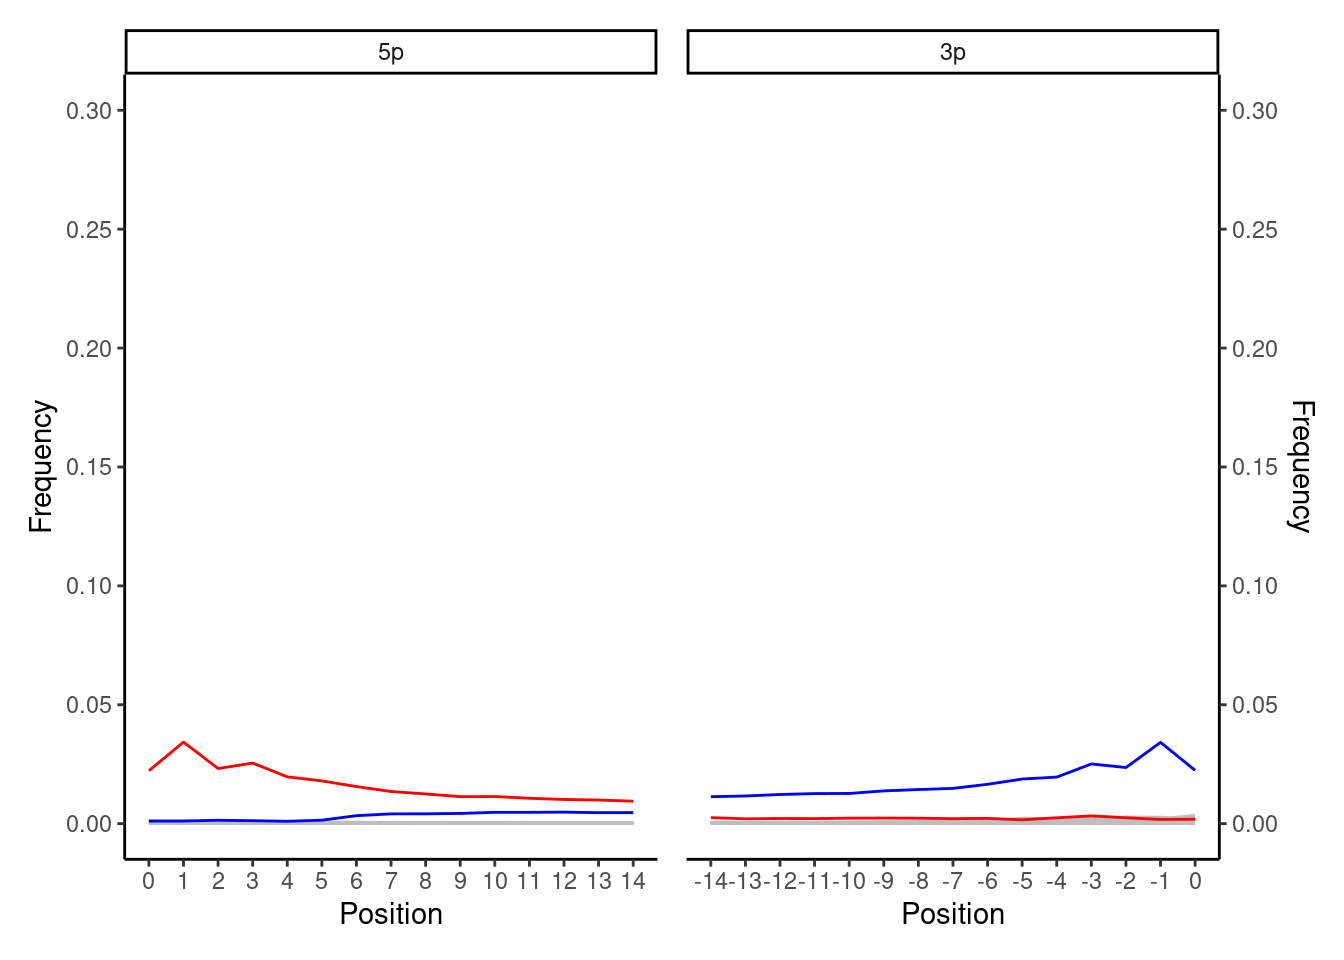
In this smiley plot, you see slightly spiky ends of the damage curves; mainly that some of the last couple of bases are often lower than expected from the rest of the otherwise classical damage curve of a constant decrease. This was observed in Brealey et al. (2020), who associated this to the explanation of reduced ligation efficiency to DNA molecules of internal barcode with a terminal G or C (i.e., short synthetic oligos with known sequences added directly prior addition of library adapters and indices) as suggested by Rohland et al. (2015).
In other words, certain internal barcode sequences with a terminal G or C do not ligate as as well to an ancient DNA molecule with a deaminated C on the terminus, and thus those read will be lost during the second round of demultiplexing as it will not contain the barcode associated with that library.
Ultimately you should not be too worried about this plot if you get it - you probably still have aligned true aDNA reads, however you may have lost a small fraction of true ancient DNA reads in that particular library. If you wish to ensure you have retained as many aDNA reads as possible, you should re-build the library from an extract but with different internal barcodes without a terminal G or C.