2 Single stranded DNA Libraries

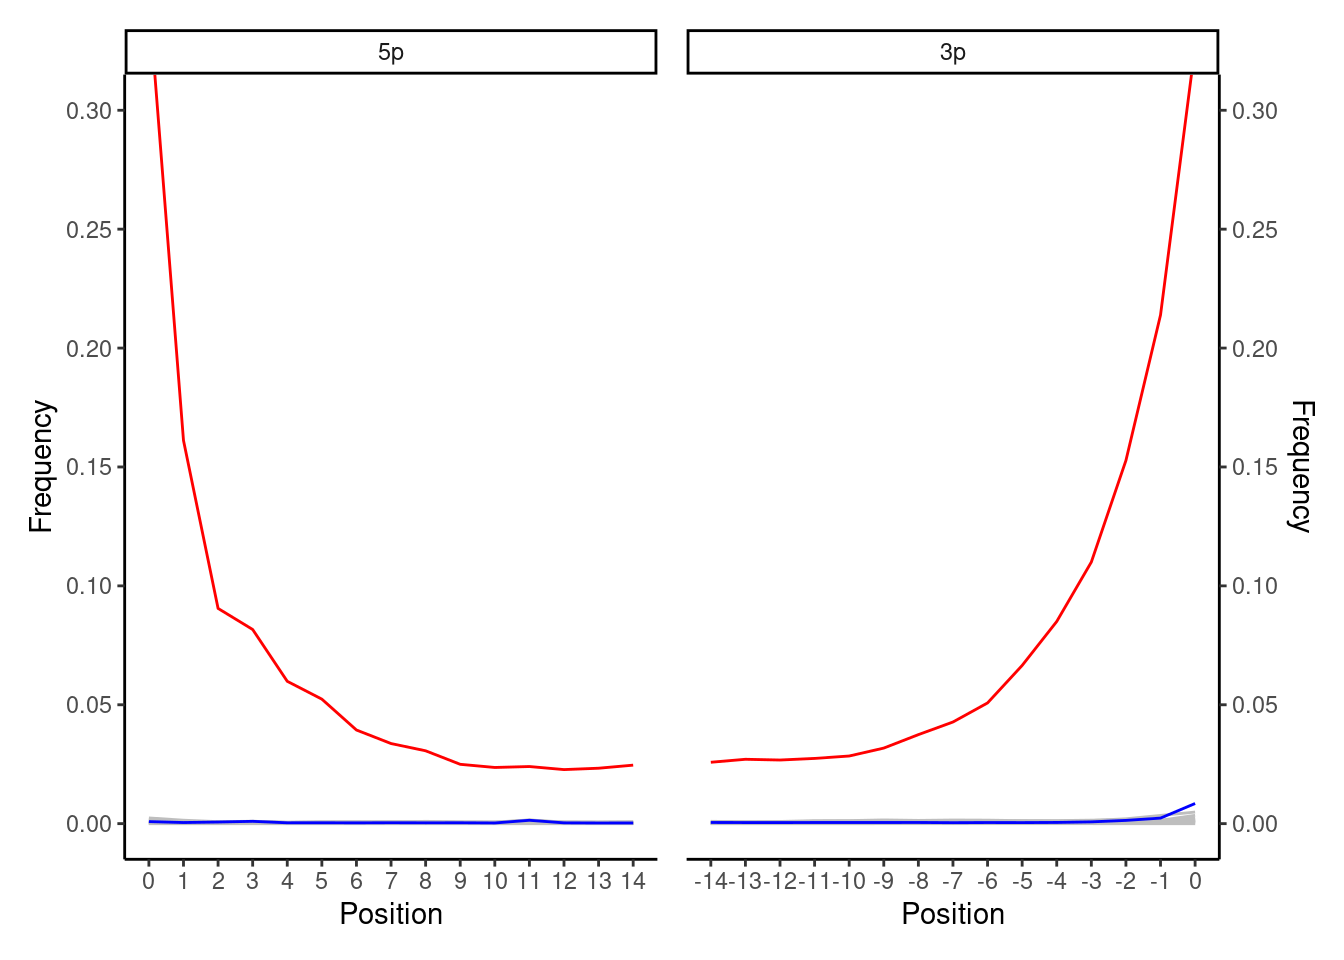
This is an increasingly common ancient DNA plot that is you will see more often as single-stranded library construction protocols become more popular. You expect to see a smooth curve from the beginning of the read (position 1) to a flat line in the middle (e.g. positions 10-25 in mapDamage plots). As with double-stranded ancient DNA libraries, the 5’ end will have the expect original C to T deamination curve. In contrast to the double stranded protocol, the 3’ of the molecule will also show the complementary C to T curve. You see the C to T deamination at both ends of the the molecule in this case, as during typical single-stranded library construction protcols (e.g. Gansauge et al. 2017) the entire DNA molecule is denatured, immobilised and then the complementary strand reconstructed - i.e., without any filling in or blunt ending. The highest frequency point of the curve can vary from 1% to ???% depending on the age and preservation of the sample.
If you get such a plot with smooth lines from ancient DNA single-stranded libraries, this is a good indication you have authentic ancient DNA!