10 Insufficient reads

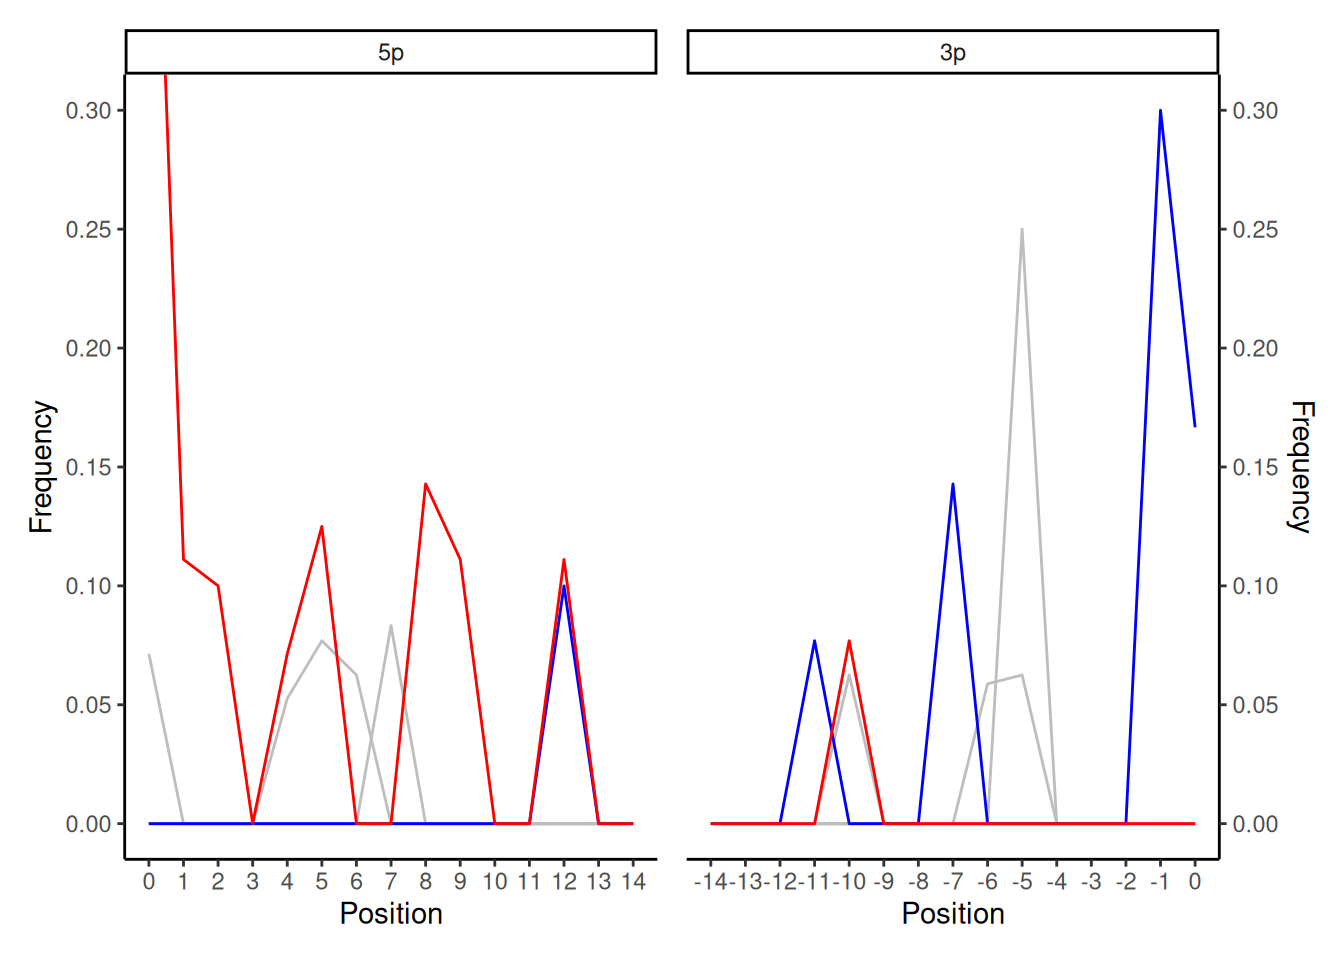
When you get random spikey lines in both 5p and 3p ends of the smiley plot, this more often than not indicates that insufficient reads are present to generate the damage profile. Given the plots are based on frequency, sufficient numbers of reads are needed to visualise the ‘fraction’ of C to T misincorporations versus the reference, if there are too few reads, this produces ‘noise’ in the line.
In this case of the example above, the aligned DNA does have a true damage signal (as indicated by the high frequency of the C-T misincorporations on the 0 and 1 positions of the 5p plot) so may give you a teeny-weeny hint of the presence of true ancient DNA. However the rest of line and also the 3p show random spikes making it very difficult to make any firm conclusion.
When you receive a plot like this, you normally need to increase the number of reads in your alignment against the reference genome (deeper sequencing, relaxing alignment parameters), or possibly you have the wrong reference genome (meaning it is not similar enough to align the reads in your library against it).