9 Excess of Short Reads
CARICATURE PLOT GOES HERE
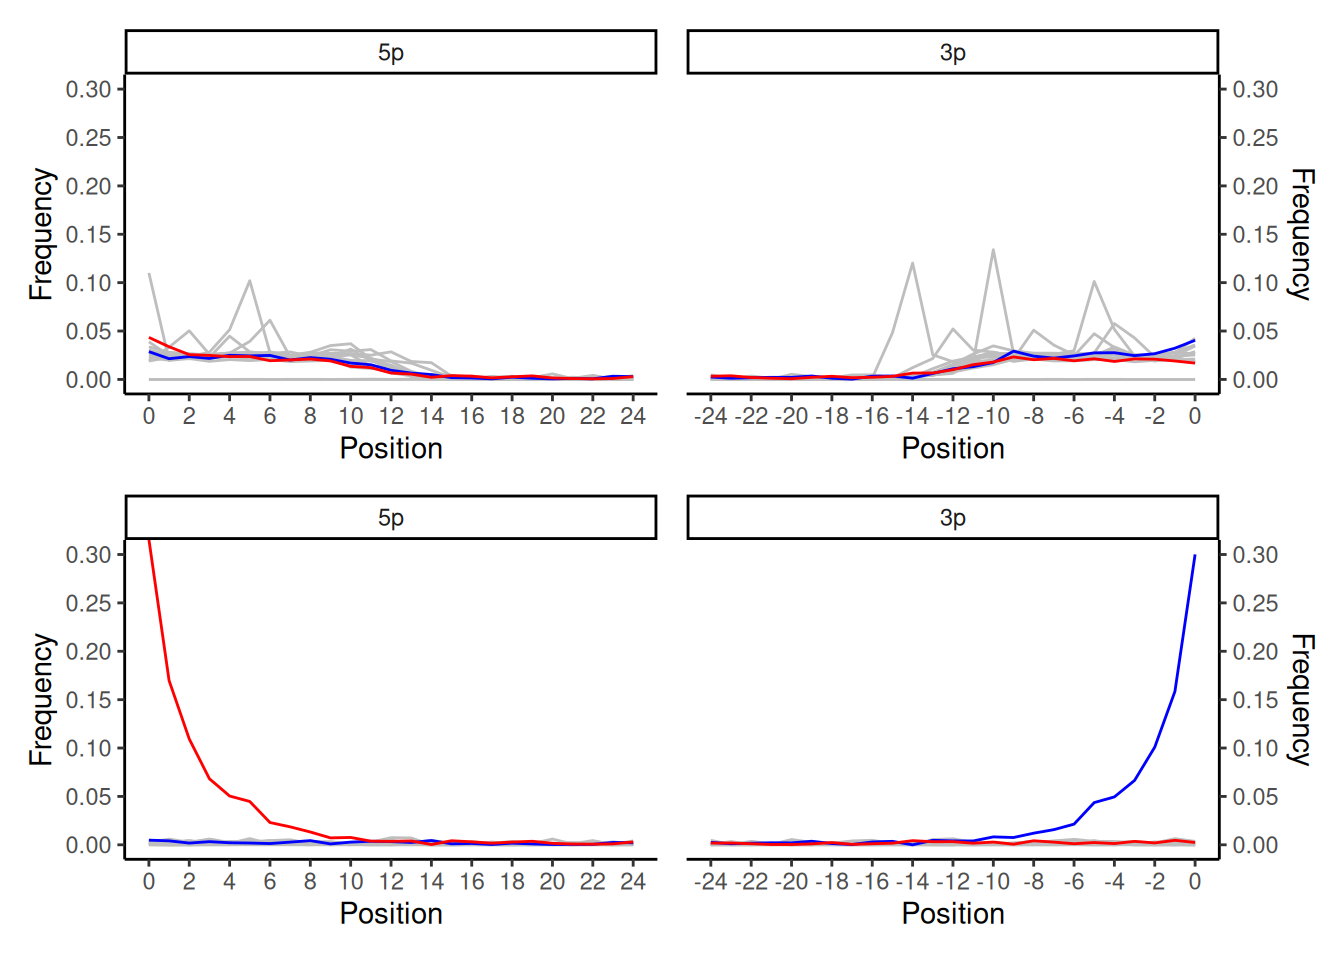
In the top smiley plot you see an odd pattern of a set of very spikey background peaks despite smooth C to T/G and A lines, and rather than an exponential decay curve the C to T and G to A lines have a an elevated ‘hump’ between 0-14 bp and then a flat line after 14bp. In contrast, the bottom smiley plot of the same sample shows a perfect double-stranded non-UDG treated library damage pattern.
So what was the difference?!
In this case Wegner et al. (2023) identified the artefact in the top plot as a result of unfiltered ultra-short reads (<30bp) mapping to the assembled contigs of their assembled genomes. This can be seen in the the fact that much of the frequency of the ‘spikey’ misincorporations are concentrated in the first 14bp of the reads, but the remaining of the curve (i.e. in teh longer reads) is nice and smooth. Without sufficient length and mapping quality filtering, these ultra short reads resulted in unspecific mapping distributed across the contigs as well as in some cases in stacking in ‘conserved’ regions of the contigs. After re-filtering to remove all reads below 30bp, the artefact disappeared and a beautiful damage pattern emerged.