Public Channels
- # 2022-summerschool-introtometagenomics
- # 2023-summerschool-introtometagenomics
- # 2024-acad-aedna-workshop
- # 2024-summerschool-introtometagenomics
- # amdirt-dev
- # analysis-comparison-challenge
- # analysis-reproducibility
- # ancient-metagenomics-labs
- # ancient-microbial-genomics
- # ancient-microbiomes
- # ancientmetagenomedir
- # ancientmetagenomedir-c14-extension
- # authentication-standards
- # benchmark-datasets
- # classifier-committee
- # datasharing
- # de-novo-assembly
- # dir-environmental
- # dir-host-metagenome
- # dir-single-genome
- # eaa-2024-rome
- # early-career-funding-opportunities
- # espaamñol
- # events
- # general
- # it-crowd
- # jobs
- # lab-community
- # lactobacillaceae-spaam4
- # little-book-smiley-plots
- # microbial-genomics
- # minas-environmental
- # minas-metadata-standards
- # minas-microbiome
- # minas-pathogen
- # no-stupid-questions
- # papers
- # random
- # sampling
- # scr-protocol
- # seda-dna
- # spaam-across-the-pond
- # spaam-bingo
- # spaam-blog
- # spaam-ethics
- # spaam-pets
- # spaam-turkish
- # spaam-tv
- # spaam2-open
- # spaam3-open
- # spaam4-open
- # spaam5-open
- # spaam5-organizers
- # spaamfic
- # spaamghetti
- # spaamtisch
- # wetlab_protocols
Private Channels
Direct Messages
Group Direct Messages

@James Fellows Yates has joined the channel


@Nikolay Oskolkov has joined the channel


@channel I've just made a channel for people working on ancient genomics (e.g. single genomes of pathogens, commensals etc). <#C01B511KU91|microbial-genomics> . Please join if you work in this area!


@Clio Der Sarkissian has joined the channel

@Meriam Guellil has joined the channel


@Antonio Fernandez-Guerra has joined the channel
Hi guys, yesterday, I was following the genotyping discussion with a lot of interest. We talked e.g. about how to distinguish between true genetic variants and the ones due to the damage, and how this could bias phylogenetic analysis. Would simple masking / clipping the ends of the reads solve the problem? You will still get enough variants (~100 000) for building a phylogeny, won't you? You really do not need more because BEAST and other phylogeny tools do not really scale for millions of genetic variants, also because of the curse of dimensionality problem, i.e. the more variants you use the more biased variance estimates you get from the Maximum Likelihood principle if you have a limited number of samples (the curse of dimensionality problem in mathematics of high-dimensional data). I wonder why people prefer to compute probabilistic genotypes instead of concentrating on most reliable ones by ignoring the ends of the reads? Is this because in the latter case you get too few variants and you want to rescue as many variants as possible?
I think it is a good idea, but it’s potential application will depend on: coverage of your sample and how far in the molecule the damage goes in (particularly for non-UDG treated data, sometimes you may lose 7-8 bases). I can see that as a good strategy for rather younger sample were you observe very little damage. I am not sure how this will work on old samples. Also, the amount of variant sites will depend on the organism you are interested in. What I am trying to say is that it is a bit hard to predict the effect and it is worth testing


@Gunnar Neumann has joined the channel
Hey Nikolay! Nice thoughts. In my experience, for the genomes of microbial strains within a species you have at least one order of magnitude less to what you said in terms of SNVs (like ~10 000 or even ~ 1 000), so there are not that many. On the other hand, sure, excluding the variants at the end of reads (e.g., 10-20bp from each side) will solve part of the problem, but you'll still have lot of transitions (most SNPs are transitions) that you don't know whether they are true variants or not. Then you can filter out positions were you have at least certain % or # of reads not supporting you variant, that would exclude some potential deamination or environmental reads, but you may also loose some true variants there as well. In my case, for a particular ancient microbial genome, with very low coverage (high-coverage >10X helps a lot in resolving these situations) I just do a manual curation to decide what to do, and I play a bit with different genotypes to see how much they affect results (phylogenies and molecular clocks(


A student in our lab recently developed a tool for filtering SNPs, where one could use different parameters for evaluation the regions around variants (e.g. coverage and heterozygosity). This has been quite helpful for evaluation, but I would say that quite some manual work is still required (e.g. read blasting) and currently works more efficiently for UDG data.
https://github.com/andreasKroepelin/SNP_Evaluation
Not really optimasized for loads of ancient genomes, as @Maria Spyrou said, loads of manual work still required. But hopefully, we can push people to make it more scalable 😉
quite thoroughly tested in Marcel’s recent paper: https://www.pnas.org/content/pnas/116/25/12363.full.pdf
I see, thanks a lot @aidanva and @Nico Rascovan for your feedback. I understand your concerns better now

@Katerina Guschanski has joined the channel
@Maria Spyrou One downside to that tool is that there is no proper documentation released yet. Makes it difficult for people who are new to it to use. There are only very very limited instructions on the tool’s help page when you open it.
Indeed, but I think it is still worth a try for people that do not want to visually inspect hundreds of SNPs in multiple samples. Happy to help anyone that might have questions.

Do people know of other tools used for qualitative evaluation of SNPs?

@Maria Spyrou @Marcel Keller Maybe you two, as experienced users, could write a tutorial/some more explanation of the parameter options for the SNPEval tool for others to learn from? Makes it much more accessible to a wider audience 😉
I agree, would be good to include some basic usage guidelines.
Yes, we could do that. @Maria Spyrou do you know if Andreas has been working on it since then, i.e. will there be a newer version available?
As far as I know he is not, I am not aware of a newer version
he is not working on it anymore. There has been discussion about reimplementing it but 🤷

@Betsy Nelson has joined the channel


Hey team, I was hoping to pick your brain on the following problem I'm encountering with MALT/MEGAN...
We build a MALT database with about 6,000 (mainly) baterial genomes with the most recent mapping file. I'm now screening coprolite data and encountered the following. When I open the rma file directly in MEGAN I get different results to when I open the sam file (paired with also the same, new mapping file).
For the same sample, the rma file gives me quite a lot of reads for Shigella boydii (140,000). This seems to be a real signal (according to Warinner's authenticity criteria) when I filter the reads with maltExtract/HOPS. Then when I open the sam file (generated in the same MALT run) I get ~85,000 reads for Enterococcus faecium, and ~105,000 reads for Citrobacter freundii, and much fewer Shigella boydii reads (~6500, which is actually about the same number after filtering of the rma files with maltExtract...).
All these species make sense in this context, but I'm so confused that they don't show up in both methods, so I don't know which results to trust? I also noticed that if I use the sam file, about double the amount of reads actually get assigned. I think the parameters might be slightly bit different in MEGAN, but surely that shouldn't make such a drastic difference? Any ideas what else it could be?
Hi @Meriam van Os, the SAM-file from MALT / HOPS does not unfortunately have LCA in it in contrast to rma6 MEGAN files, that is why you see such a difference. In other words, in MALT / HOPS SAM-files, all reads assigned to a genus / family level (multi-mappers in alignment terminology) will be randomly spread across species from that genus / family in you database.
In this sense, the SAM-file is not different from a SAM-file produced by e.g. bowtie2 / BWA. Moreover, the SAM-file from MALT / HOPS is hard to use for any filtering because it does not have a proper MAPQ, it sets all reads with MAPQ=255 (please have a look). So MALT / HOPS does not actually deliver a proper SAM, unfortunately, which is somehow hidden from the community 😞 The reason why you would like to have a proper SAM-file is because you would really want to compute a breadth / evenness of coverage metric for your microbe of interest, but it is not straightforward with the SAM output from MALT / HOPS. Rma6 MEGAN file in contrast has LCA but can not be used for breadth / evenness of coverage computation, so you will still need to run e.g. bowtie2 / BWA on the top of MALT / HOPS alignments (But then why to run MALT / HOPS at all?). Unfortunately, rma6 is not a good format for performing any bioinformatic analysis (with e.g. samtools), it can be open only by other MALT / MEGAN tools such as MaltExtract, which is a huge limitation.
Taking into account how much effort it takes to run MALT / HOPS (you have only 6000 bacterial genomes in your database, but you perhaps would really like to increase this number to have a less bias in your analysis, and then you run into RAM and time issues), we were very disappointed when we discovered that SAM-files delivered by MALT / HOPS were pretty useless. Bowtie2 is so much faster, so much less RAM demanding and can screen against the full NT / NR database, no need to cherry pick (6000 or any other limited number of) genomes. RMA6-file from MALT / HOPS has LCA but it can only give an information about read numbers assigned to each microbe. Exactly like e.g. Kraken, but Kraken can do it after a few seconds while MALT... hmmm, after a few days. However, just the number of reads is unfortunately not a good criterion of microbe detection without a breadth / evenness of coverage metric. To compute the latter you still need a proper SAM. An alternative is the KrakenUniq tool that delivers both depth and breadth of coverage and has an LCA. But then why to run MALT / HOPS at all?
Taking into account all these shortcomings, I am actually wondering why people still run MALT / HOPS? Is that only a "tradition"? I believe this issue should be more widely discussed in the community, so I would be curious to know what @James Fellows Yates, @Alex Hübner, @aidanva, @Betsy Nelson, @Maxime Borry, @Hannes, @Gunnar Neumann, @Christina Warinner, @Felix Key and other guys think. When using MALT / HOPS how do you guys prove the presence of a microbe without breadth / evenness of coverage?
*Thread Reply:* Thanks @Nikolay Oskolkov for your answer! So if I understand correctly, the rma6 files are a more accurate representation of what is is my sample, as this does use the LCA logarithm? It does seem though that when I input my sam files into MEGAN, it also applies the LCA logarithm as there is a tab with the parameters you can choose? At least when I click on "Import from BLAST".
I did also find that the MALT sam files aren't very useful for any other analysis, for example I tried samtools on them, but it didn't work. What I have been doing occasionally, is that I extract the reads I'm interested in with MEGAN, and align those with the respective species in Geneious. Does also take some extra work though, as it requires to input the fastq files into MEGAN. Or I map it subsequently to the respective species with BWA as well (same as you).
For you question why I'm using MALT. In the first instance, to be honest, I started using it as it seemed to be the kind of "standard" (and I'm still a newbie really, so MALT was an obvious choice). Gave that a go, and I have been finding it useful for screening for pathogenic/microbiome bacteria, but I use the MALT/MaltExtract results in combination with @James Fellows Yates MEx-IPA tool (https://github.com/jfy133/MEx-IPA). It generates nice reports from the rma files with the sequence identity, read distribution, damage profiles and more, which I use to authenticate the presence of species. I hope this is an okay method? If not, someone should really tell me, because this is what I've been doing for my Masters, and I'm hoping to move onto a PhD, so I want to be doing it right! 😬
*Thread Reply:* Mex-IPA seems like a nice tool, I did not know about it, thanks for pointing me! I wonder, how does it compute the breadth of coverage, i.e. what sam-file does it use? The native MALT, or the tool runs an extra alignment? @James Fellows Yates?
*Thread Reply:* @Meriam van Os to answer your question, any tool (there are not so many though) that gives breadth of coverage information in addition to read numbers is good. To my knowledge most of the tools (including MALT / HOPS) do not output breadth of coverage, so it is quite a lot of manual work you need to do afterwords. Unfortunately, just read numbers are not enough to report a mucrobe detection. There are plenty of examples of false discoveries when thousands of reads aligned at just a few conserved regions of a microbial ref genome
@James Fellows Yates has joined the channel
To summarise:
1) Nikolay is correct: SAM cannot hold LCA information, so the 'extra' reads you see in your SAM file are actually assigned higher up the LCA tree. In a way this is more accurate in terms of reads 'unique' to your specific species, which maybe useful in some cases 2) Yes, MALT SAM files are shit, we never used them. Yes RMA6 are shit because you cannot do anything else with them. Unfortunately MALT was more of a side project from the developer (long story), and HOPS was not developed with good software dev. practises in mind, so there was no effor tto make the RMA6 parser a library -> but this is irrelevant to this conversation 3) From the thread: the breadth/depth coverage information is still calculable from the RMA6 information, which is why HOPS/MexIPA cna report it. 4) The only real benefit of using MALT is that it gives you both alignment (for damage calculation) AND LCA at the same time. KrakenUniq wouldn't give you the alignment information to quickly evaluate if it's worth pursuing from an aDNA point of view
I wouldn't worry @Meriam van Os about using MALT/MEGAN/HOPS/MEx-IPA - they are still valid tools. Just not scalable or extendable.
And @Nikolay Oskolkov the reason why it's still used because at the time it was developed (2016!), we could still fit in Nt databases, and the people who developed it had enough computing resources to run it. We only ever use it as a screening tool though, not for downstream purposes
Oh and I should also a bit more sensitive/accurate over standard mappers as it's more adaptable for aDNA (spaced seed, some of the parameters)
Very nice summary @James Fellows Yates, thanks! Wait, you are writing "the breadth/depth coverage information is still calculable from the RMA6 information, which is why HOPS/MexIPA cna report it". Does HOPS report breadth of coverage? How do you compute breadth of coverage from RMA6?
At lesat I think it does, I should check! I've not looked at MEx-IPA for a long time 😆
RMA6 still holds all the alignment information, that's why you can open the alignment viewer in MEGAN and see the exact aignments

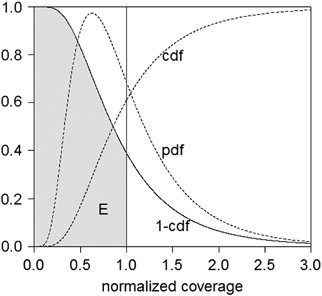
@James Fellows Yates I am quite sure that MALT / HOPS does not produce breadth of coverage, otherwise I would not complain 🙂 Hmm, the left plot is an average coverage, isn't it? I mean when you say that e.g. 6% of genome is covered with 1X, you do not know how the reads are distributed across the ref genome. What you do is compute Nreads**Lred / Lrefgenome
*Thread Reply:* Doesn't the read distribution present that? That's given as a number in the table at the top
No, but that's the value of breadth coverage no?
Percentage of genome covered, like you said?
Evenness of coverage is something else, and that is not something reported indeed (and something I've wanted for a while)
You can use https://github.com/genomewalker/bam-filter to get different types of stats related to the BAM files, for example the expected breadth or the ratio between observed/expected
A breadth of coverage you compute with "samtools depth", which reports for absolutely all bases of ref genome by how many reads it is covered. The majority of bases have zero coverage, which might result in e.g. 6% of bases covered on average. However, if the reads are spread uniformly, this still implies that the microbe is likely present. Basically, you compute a profile of what genomic locations are covered. This can be done e.g. by computing Nreadsinwindow**Lread / L_window in a sliding window
I think, I am indeed referring now to evenness of coverage. I typically use breadth and evenness of coverage as synonyms. But perhaps I am wrong
@Antonio Fernandez-Guerra with a proper BAM / SAM file there is no problem of getting breadth / evenness of coverage information. The problem is that MALT / HOPS does not deliver a proper SAM / BAM file 😞
You can calculate with any thing it provides coordinates, I am doing something similar here with the blastx like output https://github.com/genomewalker/x-filter
if the RM6 file contains this info is trivial to have a tool that does it (never used MALT though)
@James Fellows Yates on the left plot you posted, would you say that 6% of bases covered at 1X is a good indication of microbial presence? This sounds very little, but if the reads are spread uniformly, theoretically by sequencing deeper you can get a greater fraction of ref genome covered, i.e. 6% can still imply that a microbe is truly present. What I typically draw (and what I meant by breadth / evenness of coverage) is the third plot first row:

*Thread Reply:* the sample is not deeply sequenced, this is why only 3% of Y.pestis ref genome is covered, but the profile still shows a more or less uniform read distribution. An opposite example would be something like this

*Thread Reply:* the y-axis is the # of reads, and the x-axis is a genomic position. There are quite many reads aligned but they all come from the beginning of ref genome, so highly likely that this is a false-positive hit
*Thread Reply:* Yeah, I had that with all my samples that we were screening for TB.. Got quite excited at first by the amount of hits, but all was just mapping in the 16S and 23S regions
*Thread Reply:* Very sorry everyone, had a busy day yesterday with meetins and then cut short for childcare
*Thread Reply:* > would you say that 6% of bases covered at 1X is a good indication of microbial presence? Not alone no! Normally 6% would be an indicator you may have a low coverage check, and go check in IGV for evenness of coverage, like your third plot shows (how do you generate that actually? )
*Thread Reply:* I think this is a a very good point though - to me breadth of coverage is meant to be a very simplistic value representing %, evenness of coverage is by far more useful but more difficult to represent as a single value
*Thread Reply:* But this could cause confusion in the field!
*Thread Reply:* I wonder if this could be good scope for a little paper! Find various terms/phrases used in the field and make a standardised dictionary? What would you think? 🤔
*Thread Reply:* > Yeah, I had that with all my samples that we were screening for TB.. Got quite excited at first by the amount of hits, but all was just mapping in the 16S and 23S regions Yes, this is very common. Agian the purpose of MALT in our deparmtent ultimately is to find the lets say, 10s of samples our of 1000s that may have hits to a specific species, and then using mapping or capture to find the 1 real positive
*Thread Reply:* @James Fellows Yates Those concepts are very well defined in the field. I think that a more helpful paper would be one that describes good practices applied to ancient meta genomics, there you might have the opportunity to introduce those concepts in a more intelligible way and show how can they be used
*Thread Reply:* I'm not sure they always are
*Thread Reply:* A clear one is jus there: Nikolay and I disagree on the definition of breadth of coverage already
*Thread Reply:* Also do you know what cluster factor is?
*Thread Reply:* And if it differs from complexity? Or clonality?
*Thread Reply:* Or we are talking about the same thing, and just describing it differently 😆
*Thread Reply:* Yes, I read your eager documentation
*Thread Reply:* Maybe I'm misleading what I mean by standardised... I literally mean describe what they mean in one place, and in cases where there is multiple we pick the best one and recommend people use that
*Thread Reply:* the main problem is that usually we coin new terms that have been described many years ago
*Thread Reply:* Yes - that's what I mean by dictionary, I don't mean define new terms
*Thread Reply:* (sorry the standardised was probably completely misleading here)
*Thread Reply:* Just describe the existing ones and where there have been multiple new terms of the same concept we try and emphasise the use of one
*Thread Reply:* And having such a dictionary will helpfully STOP the 'new term coining' as you rightly said
*Thread Reply:* Yes, this is fine but can be made in a wiki page like we do in anvi’o https://anvio.org/vocabulary/

*Thread Reply:* But I dunno... maybe it's not so useful. @Nikolay Oskolkov as an outsider moving laterally into aDNA and @Meriam van Os who is (sort of new) to aDNA think?
*Thread Reply:* > Yes, this is fine but can be made in a wiki page like we do in anvi’o https://anvio.org/vocabulary/ yes I considered that, but it's not very visible
*Thread Reply:* A paper would be picked up by more people ,and make it easier to cite if people want to say 'use this term following the definition by XYZ (et al)'
*Thread Reply:* The ANVI'O wiki is nice, but is that generated from a consensus of a field? Or 'opinionatd' selection. Also I don't see much background behind the terms either
*Thread Reply:* You need to add value to the paper, a good practices will accomplish the same and be more valuable for the community
*Thread Reply:* (although it is very nice with the descriptions though, looking through it 👍
*Thread Reply:* for example at f1000 we can have a rolling paper that gets updated as the field advances
*Thread Reply:* That would be PERFECT
*Thread Reply:* Very good idea
*Thread Reply:* What exactly do you mean by best practises though, in this case?
*Thread Reply:* You can get stickers https://twitter.com/merenbey/status/1499737607940542471?s=21&t=BM7Lui3tGkWWVMUpVF9Eg|https://twitter.com/merenbey/status/1499737607940542471?s=21&t=BM7Lui3tGkWWVMUpVF9Eg
 }
}
*Thread Reply:* @James Fellows Yates by best practices I wold mean a primer (with all the codes) of how a typical analysis is done and what can be pros and cons of different filtering / screening strategies
*Thread Reply:* Oofff, that's a much bigger and 'controversial' project. It would be much more difficult to coordinate.
*Thread Reply:* I agree, it is not easy
*Thread Reply:* @James Fellows Yates to answer your question about evenness of coverage, it is just visualizing the output of "samtools depth" where I count reads in a sliding window along ref genome
*Thread Reply:* But do you think terms would be useful?
*Thread Reply:* (at a minimum)
*Thread Reply:* I do think terminology is useful but I would add it to the primer, i.e. not as a separate paper
*Thread Reply:* A super simple R script that reads the "samtools depth" output and plots it is here:
BREADTH OF COVERAGE
FIXME: empty due to failed samtools sort
df<-read.delim(paste0(outdir,"/",RefID,".breadthofcoverage"),header=FALSE,sep="\t") Ntiles<-100 step=(max(df$V2)-min(df$V2))/Ntiles tiles<-c(0:Ntiles)step V4<-vector() for(i in 1:length(tiles)) { dftemp<-df[df$V2>=tiles[i] & df$V2<tiles[i+1],] V4<-append(V4,rep(sum(dftemp$V3>0)/length(dftemp$V3),dim(dftemp)[1])) } V4[is.na(V4)]<-0 df$V4<-V4 plot(df$V4~df$V2,type="s",xlab="Genome position",ylab="Fraction of covered genome",main=paste0("Breadth of coverage: ",RefID," reference")) abline(h=0,col="red",lty=2) mtext(paste0(round((sum(df$V3>0)/length(df$V3))100,2),"% of genome covered"),cex=0.8)
*Thread Reply:* What is the issue with: Warinner, Christina, Alexander Herbig, Allison Mann, James A. Fellows Yates, Clemens L. Weiß, Hernán A. Burbano, Ludovic Orlando, and Johannes Krause. 2017. “A Robust Framework for Microbial Archaeology.” Annual Review of Genomics and Human Genetics 18 (August): 321–56. https://doi.org/10.1146/annurev-genom-091416-035526.
in this case?
*Thread Reply:* I think this all sounds super helpful, speaking as someone moving into this field, and someone who doesn't have anyone around at their university who does this this kind of analyis! I agree with Antonio, that it would be good to combine it with a discussion of "good" practises, what sort of analysis are needed to be very sure about a positive signal. I've been using Warinners paper that talks about some of the authenticity criteria, but I doesn't go into all those terms (from memory).
*Thread Reply:* Ok. That's good to know but the problem is there are not really 'good practises' tbh
*Thread Reply:* It's all too new, so we will have to wait a long time for that to chrystallise (just as a warning)
*Thread Reply:* @James Fellows Yates I read this paper, my understanding was that it was too abstract and not so much hands-on, but I might be mistaken, need to perhaps have another look
*Thread Reply:* They discuss the criteria very nicely though, I've been using those criteria as my baseline
*Thread Reply:* we don't have enough dedicated tools to compare, not enough benchmarking tools to find the consensus unfortunately
*Thread Reply:* Section 7.3 should cover everything I think
*Thread Reply:* Eveness of coverage, Percent identity, ec.
*Thread Reply:* @James Fellows Yates perhaps people in the field are aware of the problem of false discoveries (as you say 1 out of 100 can have a real hit), but talking about e.g. ISBA last year I saw only two talks showing the evenness of coverage (Lucy van Dorp and someone else), however everyone shows the deamination profile. In my opinion it should be the opposite. It is quite trivial to get a good looking deamination profile from an ancient sample, but super difficult to prove that the microbe you mean is actually there. What I saw at ISBA was that everyone (like Hannes) says "we got ~500 reads assigned to this microbe / eukaryote" without demonstrating the evenness of coverage. sedaDNA folks never demonstrate the evenness of coverage (sometimes they even do not demonstrate deamination profile). If people are aware of the problem, why is this somehow under-emphasized and almost hidden?
*Thread Reply:* There is a variety of reasons:
1) (Modern) reviewers are often much more skeptical of aDNA in the first place, so proving that it's ancient often takes more precendent 2) Each microbe has it's own characteristics you need to prove. For example, take Y. pestis actually eveness of coverage of the genome is somewhat irreelevant to show a person was carrying it - providing it has the Ymt gene or pCp or PmT plasmid is MUCH better proof. But of course only that species has that plasmid 3) Most people are looking targetting for high fold coverage rather than evenness/breadth - this is why people have switched to captures, at which point eveneness is also secondary. You can have a patchy genome but with more confident SNPs that allow you to place it on a tree (assuming you have proof, e.g of species specific plasmids) 4) Often people are presenting at conferences prelminary data, and will only say that to show they are candidate taxa (and they will subsequently do deeper sequencing/whole genome stuff) 5) People often don't have enough genomes for it to be worth, or sufficient knowledge, to programatically check evennes sof coverage . They will check this manually in IGV and assume if people doubt their claims will check it themselves
*Thread Reply:* 6) and in some cases indeed naïvity of course 😉
*Thread Reply:* IGV manual checking is a big one
*Thread Reply:* I happened to recently work a lot on sedaDNA projects and can honestly say that it is complete chaos. Since you do not have a host, i.e. a clear #1 candidate, the screening results are very difficult to interpret, it is a horrible mixture of microbial, human, plant and mammalian reads. The evenness of coverage is perhaps the most helpful metric to separate false from true discoveries. However, when I read sedaDNA papers, I need to go to a supplementary of a supplementary to find (sometimes!) an evenness of coverage plot (in vast majority case I do not find it). The evenness of coverage should be the Figure 1 of a paper. Instead, there are lots of phylogeny plots, lots of words about what animals / plants were discovered without showing a single evidence (not even deamination profile is shown).
*Thread Reply:* I can't really comment on sedaNDA unfortuantely.
But how do you make evenness of coverage plots across 100s of taxa 😉
*Thread Reply:* (to play devils advocate)
*Thread Reply:* My understanding is human-associated microbial genomics is a little more routine in that manner
*Thread Reply:* You make an evenness of coverage plot per species of course. So if the paper says "we have discovered a mammoth in a sedaDNA sample" there should be some evidence shown, not just reporting the number of reads
*Thread Reply:* But you have figure limitations, you can fit for many taxa a single value of reads in a table 😉
*Thread Reply:* (again devils advocate)
*Thread Reply:* But you are ultimately right
*Thread Reply:* Might good little <#C02D3DJP3MY|spaam-blog> post if you're up for it
*Thread Reply:* No-no, I am talking about most interesting hits. Say you found a few interesting mammals in the sand of Denisova cave, there should be some proof shown
*Thread Reply:* Ok but in that case, they did mitochondrial capture
*Thread Reply:* and got 10X with 98% covered, why is evennes necessary?
*Thread Reply:* you should start with a proof that the animal is actually there, and not with phylogenies
*Thread Reply:* (sorry @Meriam van Os for the spam, maybe we should move this outside the thread)
*Thread Reply:* > and got 10X with 98% covered, why is evennes necessary? is that not proof?
*Thread Reply:* I do not recall "10X with 98%" but this should be Figure 1 in my opinion and not hidden in a supplementary of a supplementary. People should not search for it
*Thread Reply:* How do you do that when you have 500 samples, across 30 species 😉
*Thread Reply:* (sorry, the 10X and 98% was theoretical)
*Thread Reply:* Reviewers are less and less intrested in proof unfortunately. That doesn't make an interesting nature paper nowadays...
*Thread Reply:* I do agree with you though
*Thread Reply:* a typical presentation / paper is like this: they show pictures of the historical place (e.g. a cave), then a table of animals / plants found, and then phylogeny. I don't get why people (who are aware of the false discovery problem) do not try to convince the audience that the animal / plant is actually there
*Thread Reply:* Bt anyway to conclude: and I think eveneness of coverage is underrepresnted, I think you could make a very good argument and helpful tutorial if you were to show how to programatically generate plots like in your example above - because manual checking in IGV is indeed very suboptimal
*Thread Reply:* Since I know how hard it is to prove that say a bison is actually a true hit, I would concentrate my talk on this 🙂
*Thread Reply:* We are developing many tools to deal with what @Nikolay Oskolkov is saying about sedaDNA
*Thread Reply:* > a typical presentation / paper is like this: they show pictures of the historical place (e.g. a cave), then a table of animals / plants found, and then phylogeny. I don't get why people (who are aware of the false discovery problem) do not try to convince the audience that the animal / plant is actually there But, ok if you have sufficient coverage to place it in a phlylogeny, and falls correctly within Bison when you have a I dunno... sheep outgroup, why is that not sufficient proof if it's a Bison?
*Thread Reply:* From that perspective - if anything, evenness of coverage is again not really releveant. If you have pick up enough regions that hold SNP diversity that allows (sensible) placement in the phylogeny, that's enough, no?
*Thread Reply:* > We are developing many tools to deal with what @Nikolay Oskolkov is saying about sedaDNA Where are they then 😉 (teasing)
*Thread Reply:* @James Fellows Yates the conclusion about a hypothetical bison is often made based on ~20-30 reads. Does it sound crazy to you? I am not kidding. Really, they make phylogenies based on at max 100-200 reads
*Thread Reply:* The SNPs that determine the placement in the phylogentic tree can be from the damage or sequencing errors if we talk about that low amount of reads
*Thread Reply:* Depends, that's exactly what they can do with Neanderthals.
100-200 reads can give you pretty good coverage on a mitogenome even.
But ultimately this comes back to my point it depends very highly on context.
Evenness of coverage I consider to be more important for microbial stuff, as if you have large missing regions these may contain gene-level species 'identifiers'
*Thread Reply:* > The SNPs that determine the placement in the phylogentic tree can be from the damage or sequencing errors if we talk about that low amount of reads Depends! If you have sufficient informative SNPs and you know the approximate damage
*Thread Reply:* Perhaps! From my testing, indeed, ~20-30 reads can have e.g. mammoth-specific alleles. So they might very well be indeed mammoth reads. But I wonder how many such "mammoth-looking reads" you can get if you e.g. slice a wolf genome, damage it and inject sequencing errors? This should be discussed openly. And a I see a lack of such discussions 😞
*Thread Reply:* But Ok, sorry I'm being a bit facetious now sorry @Nikolay Oskolkov - it's not personal.
I just find it frustrating that people come in complaining about this sometimes and reviewers can be extremely dismissive without reading specifically how each group do validate these things. As some groups can be VERY careful. But equally the people who are very dismissive don't bother to actually make such tools to make this easier...
And unfortnuatey the few tools exist are not well made (HOPS ofr example), so this is a pain point for me too.
This could be a good in-person chat to have over SPAAM4 if you're joining that?
Maybe a best-practises validation publication with more practical examples is a good idea... but often I've seen lack of interest from the experts in this matter
*Thread Reply:* > Perhaps! From my testing, indeed, ~20-30 reads can have e.g. mammoth-specific alleles. So they might very well be indeed mammoth reads. But I wonder how many such "mammoth-looking reads" you can get if you e.g. slice a wolf genome, damage it and inject sequencing errors? This should be discussed openly. And a I see a luck of such discussions 😞 Very true... but often they are tricky things to describe concisely so has to be forced into the SI 😞
*Thread Reply:* You saw the size of my SI in my PNAS paper?
*Thread Reply:* Actually...
*Thread Reply:* No, I am afraid not 🙂
*Thread Reply:* @Nikolay Oskolkov So I had actually previously proposed a paper like this: https://journals.plos.org/ploscompbiol/article?id=10.1371/journal.pcbi.1009823
but for ancient microbial genomics validation to one of the research gorups I'm in. But there was little interest from the leadership
*Thread Reply:* You are welcome to take the idea and run it in SPAAM?
*Thread Reply:* > No, I am afraid not 120 pages
*Thread Reply:* https://paperpile.com/shared/evliy7
@Nikolay Oskolkov this is what we usually compute using https://www.sciencedirect.com/science/article/pii/0888754388900079?via%3Dihub and https://www.nature.com/articles/jhg201621

and summarizes your third plot
I'm a bit confused, wouldn't it be possible to calculate evenness of coverage from the rma6? (I'm sorry if this is a stupid question, I haven't worked with rma6 directly)
The rma6 files should contain the positions where it is mapping in a reference
*Thread Reply:* @aidanva in theory yes, but nobody knows how except for MALT /HOPS developers 🙂 This is why MALT / HOPS is a bit of a black box, there is no way the community can customize MALT output 🙂
*Thread Reply:* Yeah, ok, that's is totally true. We should push them to report evenness of coverage
And as Antonio days that's what you need right?
*Thread Reply:* Internally this information should be there, yes, but you need to be the author of MALT / HOPS in order to know how to extract it. At least I never managed 🙂
Since HOPS also have a destacking (like a duplicate removal) option
I have no idea about the RM6 format
That could also give you any indication if all of your reads are coming from similar regions, by comparing the total number to the destacked number reported by HOPS, if the second one is considerably smaller than the total, then you are mostly mapping to conserve regions and it is probably a bad candidate for further work
Wow, didn't expect so much involvement. Thanks everyone! This is super helpful!!
@Nikolay Oskolkov @James Fellows Yates Isn't the evenness of coverage represented in the read distribution in the table at the top? Which I always thought was calculated by; Number of covered bases on reference genome / Total bases mapped to reference. So if there are duplicated/clusters the total mapped bases will be higher than the number of covered bases. In other words, if there is an even distribution, this number should be 1, and the lower it is, the more clustering. I think that's right?

@Meriam van Os the piles of reads do not necessarily come from duplicates, there might be unique reads all coming from jut one chromosome (now I am talking about eukaryotes for simplicity), so other chromosomes are not covered at all, not a good sign 😞
*Thread Reply:* Aah, that is a very good point, I actually never really thought about that oops 😅 why does no-one talk about this in papers haha? Or I may have missed it... 😬 Okay, I'll go map the potential present microbes and make some nice coverage plots!
*Thread Reply:* Sorry @Meriam van Os, I need to explain properly. An uneven ref genome coverage looks (if you check in IGV) like reads forming "piles", i.e. lots of reads mapped here and lots of reads mapped there but nothing in between. What you really want to see is that all reads are mapped at unique genomic positions, no matter how many at each position, one is enough. In this case, shallow sequenced samples can give on average maybe 6% of bases covered. This is simply because there are not enough reads to cover all bases of a long ref genome. So 6% of bases covered might imply that the reads are spread non-uniformly (as you said, cluster at certain places), or uniformly but there are simply too few reads to get a higher percentage of ref genome covered. So you need to plot how coverage varies vs genomic position to really see that the majority of reads come from unique genomic positions
*Thread Reply:* @Meriam van Os you're very right - but that is the problem it's very difficult to represent unevenness in a single value.
So the purpose of that field in HOPS output is to remove the clearly false positive samples - you should always either do mapping and check with IGV or make nifty little plots as Nikolay has done
*Thread Reply:* Yeah that makes sense!
also you have all the mobile genetic elements, prophages and others that recruit many reads
Also would like to point out @Nikolay Oskolkov (to be a bit cheeky) - MALT/HOPS is not a blackbox - all the code is open-source and viewable!
https://github.com/danielhuson/malt https://github.com/rhuebler/HOPS https://github.com/rhuebler/MaltExtract https://github.com/keyfm/amps
You just need to learn Java first 😉